|
|
|
Last update on:
Dec 03, 2015
| Uptime: 331 days, 12h, 4m |
Number of requests: 6068449
since 28 October 2005
|
|
|
|
|
|
|
|
Interactive clients' System Design
Using the interactive clients (MonALISA Client and VRVS Client) the user has an intuitive graphical and global interface
of the states of the distributed monitored systems.
After discovering all available monitoring services using the MonALISA Registration and Discovery mechanism
the client requests history and real-time data from the services the user is interested in, and dinamically updates its
interface as the state of the system changes and real-time monitoring data come.
The graphical interface is composed of several dinamically loadable panels that statistically shows
the monitoring sites in the global system. The user can also influence the system, if it has rights,
using the administration interfaces.
- The 3D Map Panel locates the MonALISA monitoring services on a 3D view of the world geographical map.
It also shows the monitoring WAN links, real-time traffic on them, the capacity of the links, the ABPing connectivity
between sites, the optical switches controlled and other parameters like sites' Load, CPU usage, IO parameters, etc.
Figure 1 shows a screenshot of this panel.
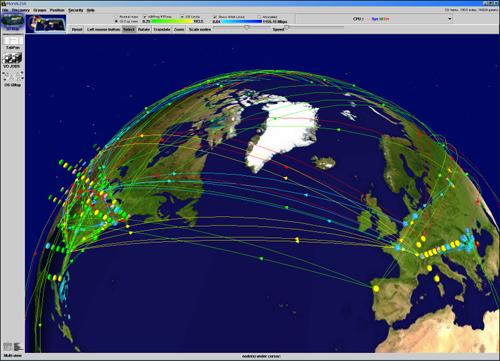
Figure 1: GUI Client - MonALISA Client 3D Panel
- The Groups Panel presents all the communities with all their monitoring sites. The user can plot common parameters
from the selected sites from a community. The plot shows comparatively history or real-time parameter values from selected sites.
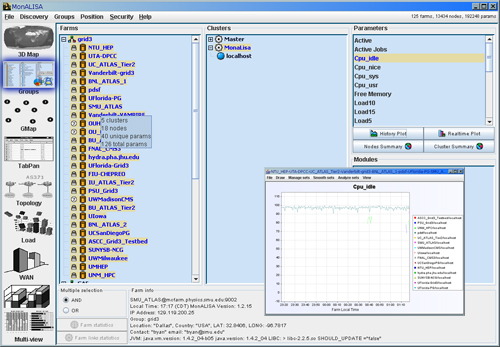
Figure 2: GUI Client - Groups Panel
- The TabPan Panel shows information about all running MonALISA service processes and about their environment, like
uptime, version of the monitoring service, localtime on the running machine, etc.
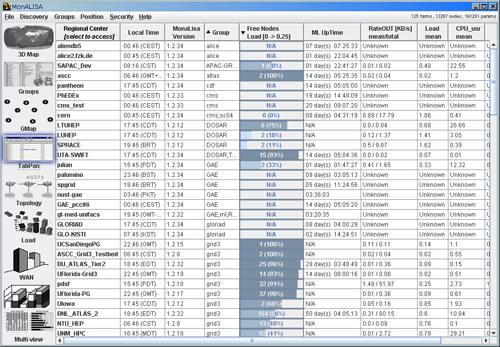
Figure 3: GUI Client - TabPan Panel
- The GMap Panel - Constructs a Graph Map of linked nodes and applies several layouts to it: Random, Grid, Radial, Layered,
Map, Elastic. The link between two sites represents the quality of the conectivity between those sites, value measured by the
MonALISA ABPing module.
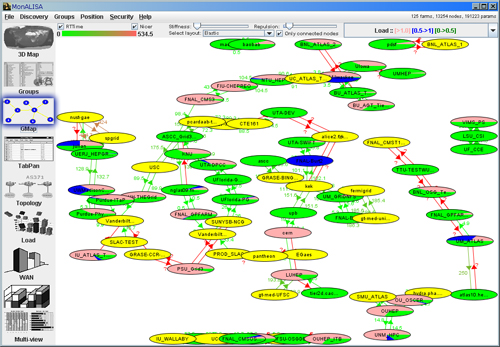
Figure 4: GUI Client - GMap Panel
- the WAN Topology Panel constructs a detailed Topology Map of the MonALISA services and
intermediary hops between them.
It can provide information about the routers, networks and asynchronous systems on the way, as weel as
latencies on each of the discovered segments. Each MonALISA service can run a specialized module that performs traceroutes
to other services and discovers the hops and the delays on each discovered segment.
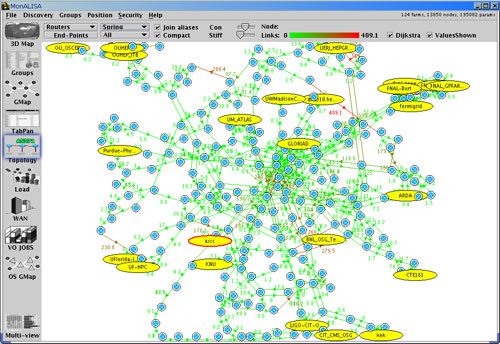
Figure 5: GUI Client - WAN Topology Panel
- The OS GMap Panel shows the state of the MonALISA monitored optical switches, the machines connected
to them and the created optical pathes. It uses different layouts for dispaying: Random, Grid,
Radial, Layered, Map, Elastic. If authorized with the right credentials, one user can administer the network of optical swithces,
from the panel administration interface, creating or releasing optical pathes.
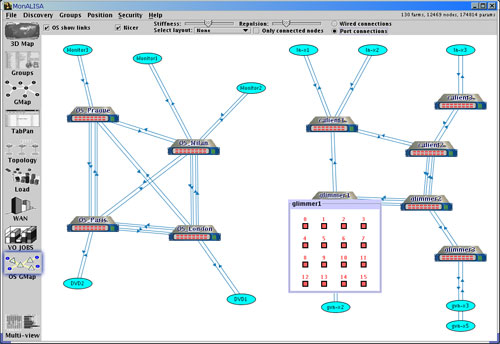
Figure 6: GUI Client - Optical Switches connections Panel
- The VO Jobs Panel globally shows the existing jobs from every site, the states of the jobs (how many jobs per site are idle
and how many are running on every site) and from which site they have been submitted.
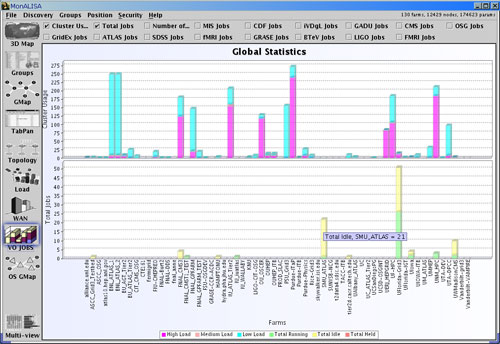
Figure 7: GUI Client - VO Jobs Panel - Jobs distribution on sites.
- The WAN Panel is dedicated to WAN traffic. It plots in a single window all WAN traffic
through each monitored WAN link by MonALISA services. Shows the inbound and outbound WAN traffic for each link.
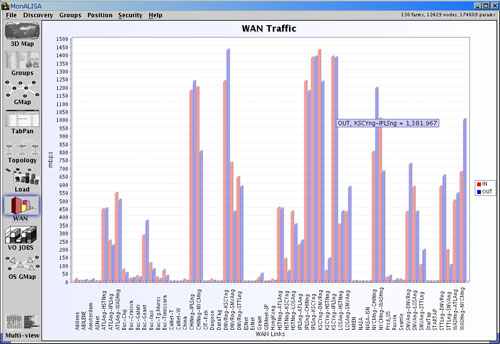
Figure 8: GUI Client - WAN Traffic Panel - traffic in and out for monitored WAN links.
- The Load Panel globally shows the load distribution on every monitored site, the number of nodes
that are not loaded (have load lower than 0.5 ), the number of nodes that are medium loaded (have load between 0.5 and 1) and
the number of nodes that are loaded (have load more that 1).
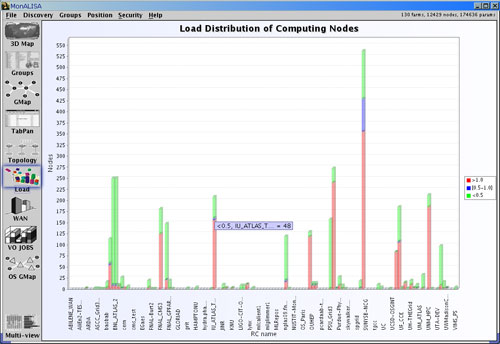
Figure 9: GUI Client - Load Panel - load distribution per site.
|
|


