The global monitoring service client allows to discover
all the active services, and display real-time global views
for connectivity and traffic as well as the usage and load
of the monitored entities.
It allows to access the configuration of any site and
display real-time or historical values for any monitored
parameter in the system.
Using the WebStart technology, it can be started from
anywhere, with just a single click in a browser window.
1. Requirements
In order to run the MonALISA Client, the following
program tools must be installed:
Java 2 Runtime Environment, version 1.4.2 or
later. You can download it from http://java.sun.com/j2se/. It includes
the Java Web Start technology. In case Java Web
Start is missing or misbehaving, you can get the
latest version from http://java.sun.com/products/javawebstart/.
2. Main Window
The main menu of the application has the following
items:
File
Contains only the Exit command.
View
This menu can be used to customize the GUI
interface.
Small icons option sets the dimension of
left vertical menus' icons to normal or small
size of the main window.
3D Map Options provides a set of settings
only for the 3D Map panel.
Map
options
Shows a window that can set the path
to repositories of maps, the path to
where local cache should be stored and
the starting resolution that should be
used for the map.
show
cities
Renders on the map the locations of
at least one major city from all around
the world, and also, at least one city
for each US state.
update
shadow
Updates or not the shadow on map, as
the sun moves around it.
show rotation
bar
This option shows small bars on
edges of the 3D map, that allow
vertical or horizontal rotation of the
globe.
show rotation bar
tooltip
Attaches to the rotation bar a small
tooltip to indicate how the bar can be
used.
download new
images
Should new images, for higher level
of detail, be loaded on the map, or use
only the ones in local cache.
show night
shadow
Show or hide the shadow made by sun
on earth.
show night
lights
Show or hide the night cities lights
on the world map.
show country
borders
Show or hide political borders of
all coutries on the world, and the US
states borders.
show
moon
Show or hide the moon that revolves
around the globe.
Rotation Bars
Size
Through a drop down menu allows to
choose the width of the rotation
bars.
Discovery
This menu can be used to change the discovery
process of the monitored entities. There are two
parts regarding this process:
the Lookup Services hosts - used in the
Jini discovery of the Proxy Services. These
are fixed for each type of client and should
not be changed.
the available Groups - used in the Jini
discovery of the groups to which the
monitored entities are subscribed. Usually,
the MonALISA Client already comes with all
available groups added so adding a new one is
necessary only in special situations.
Groups
This menu can be used to switch on/off the
currently active groups. Usually, different types
of monitored entities are grouped in separate
groups. You can use this menu to add/eliminate
(un)necessary entities from the client views.
The first two options allow easy selection and
deselection of all groups.
If there are many groups the application uses,
they are shown in succesive menus, introduced by
the "More..." menu option.
Position
Positions the nodes on the map according to each
node's custom latitude and longitude, or,
automatic, meaning that each node is put on map
based on coordinates found from ip queryies.
Security
This can be used to specify a keystore and a
password that allows controlling the entities. More
on this in the Node
Properties Window section.
Help
This brings a window with some nice
screenshots.
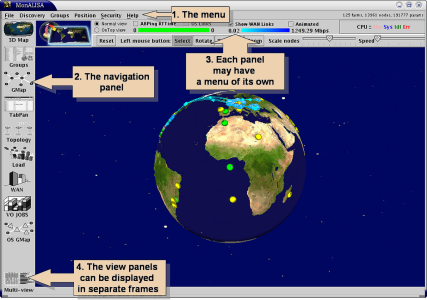
On the left side of the main window, there is a list
of labelled icons with the active panels. These can
operate in two modes:
single view - each panel is displayed in the
main window. When other icon is clicked, the
current panel is replaced by the new one.
multi view - the current panel remains in the
main window. Clicking other icon opens the
respective panel in a new window. Clicking the icon
again closes that window. Clicking the "Multi-view"
icon closes all opened windows.
Client's main components.
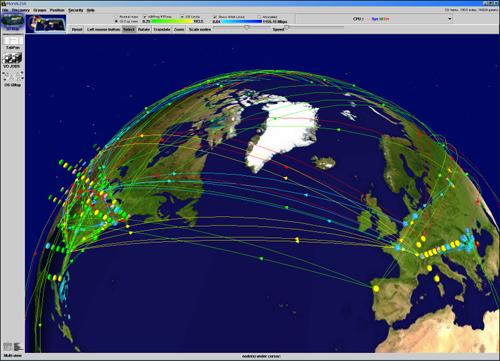
2.1. 3D Map Panel
The monitored entities are displayed on a 3D Globe
that can be manipulated with the mouse. You can
left-click on an entity to open the corresponding
property window (See Node Properties Window
section for more details.) You can zoom in/out using
the mouse wheel. Right-clicking and dragging rotates
the globe. Left-clicking and dragging moves the globe.
The options bar allows also to zoom or rotate the globe
using the slider.
3D Map Panel
If the mouse is moved over a node or arrow of a
link, a short text is displayed, showing status
information. The information shown on the nodes and
links can be changed using other buttons above the
panel.
For a description of the values shown for each node
and link please see the client specific details in Farm Client and VRVS Client sections.
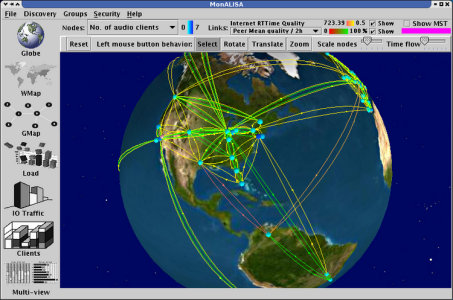
2.2. Globe Panel
The monitored entities are displayed on a 3D Globe
that can be manipulated with the mouse. You can
left-click on an entity to open the corresponding
property window (See Node Properties Window
section for more details.) You can zoom in/out using
the mouse wheel. Right-clicking and dragging rotates
the globe. Middle-clicking and dragging moves the
globe. These operations can also be performed with the
left button by selecting one of the buttons above the
panel (Translate, Rotate, Zoom).
The Globe Panel
If the mouse is moved over a node or arrow of a
link, a short text is displayed, showing status
information. The information shown on the nodes and
links can be changed using other buttons above the
panel.
For a description of the values shown for each node
and link please see the client specific details in Farm Client and VRVS Client sections.
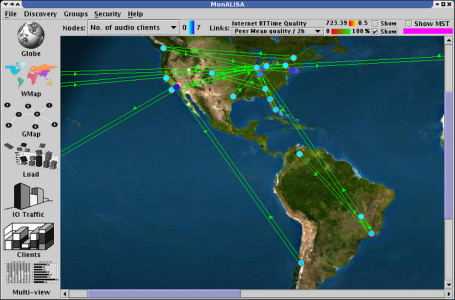
2.3. Wold Map Panel
The monitored entities are displayed on a flat world
map. Left-clicking a node brings the corresponding
property window. Using mouse wheel you can
incrementally zoom in/out the respective area of the
map. You can also zoom in by selecting a region with
the right mouse button. Right-clicking the map restores
the original zoom state.
The World Map Panel
If the mouse is moved over a node, after one second
a tooltip will be displayed, showing information about
the node. The information in the node can be changed by
the buttons and combo boxes on top of the panel.
For a description of the values shown for each node
and link please see the client specific details in Farm Client and VRVS Client sections.
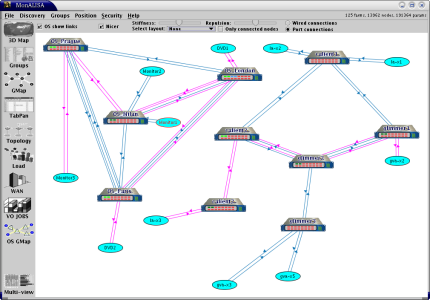
2.4. Graph Panel
This view represents the entities in a graph-like
form. The nodes can be moved with the middle mouse
button. Left-clicking a node brings up the
corresponding property window. Right-clicking a node
makes the selected node a "source" node. Starting from
that point the client will compute a path towards the
other reachable nodes. There are several layout modes
for the nodes, modes that can be changed selecting one
of the buttons above the graph panel. If a tree can be
computed, the "Tree layout" modes will be
available.
The Graph Panel
The information shown for each node can be changed
with the combo-boxes above the graphical area of the
panel.
For a description of the values shown for each node
and link please see the client specific details in Farm Client and VRVS Client sections.
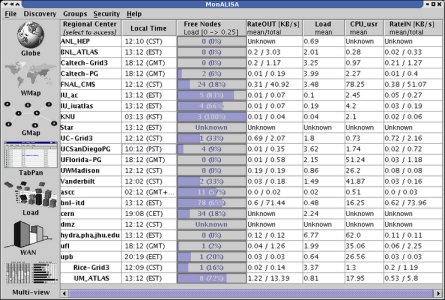
2.5. Table Panel
This panel shows a table with various details for
each entity.
The Table Panel
This table can be sorted by clicking the caption of
table's columns.
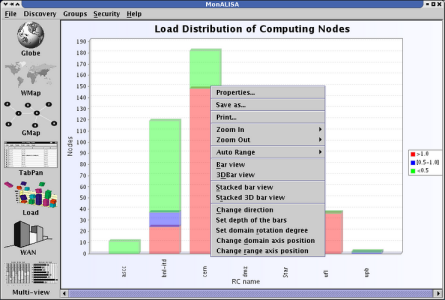
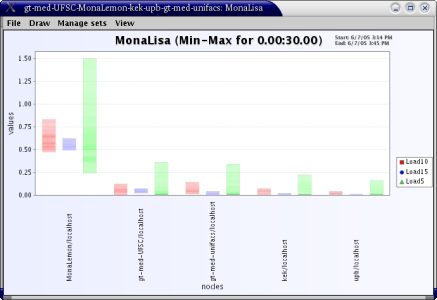
2.6. Histogram Panels
In these panels a bar chart with different values is
drawn for all entities. If there are more values for
each entity, the histogram can be drawn as a stacked
bar.
The Load Histogram Panel
Right-clicking on the panel brings up a menu from
where you can change the colors, the type of the chart
(simple, stacked), appearance (plain or 3D),
orientation etc. You can also save the chart in a .png file.
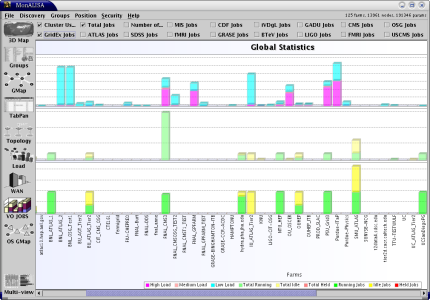
2.7. VO Properties
Window
When the monitored entities (farms) are involved in
different VO (Virtual Organtionzations) experiments the
monitored behaviour of those entities with respect to
their involvment in the experiments is represented in
this panel.
The VO Panel.
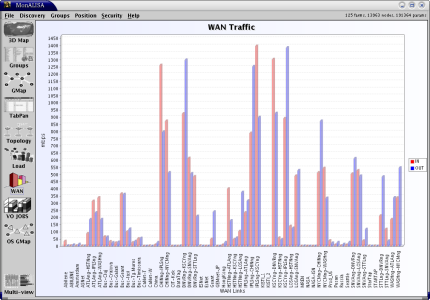
2.8. WAN Properties
Window
This panel offers a global status view of the the
monitored physical links existing between the monitored
farms.
The WAN Panel.
2.9. Groups Panel
Window
This panel offers a global view of all monitored
farms. The farms are listed according to their groups.
Each visible group (the groups that are selected from
the menu of the Client) are represented here in a
hierarchical view, each farm beeing one of the node of
each group from which it belongs. Each farm has an
associate icon that represent the administration right
of that specific farm. By selecting any number of farms
(or by selecting a group - which is equivalent to
selecting every farms in that group) in the second
panel the clusters and nodes representative for the
selection will be represented. There are two modes in
which the selection can be made, by using an and
operation (show every clusters and nodes) or by using
an or operation (show every cluster or every node
belonging to each of the farms).
This panel can be used for instance to plot together
parameters beloning to different farms all together.
Available in this plot also are buttons that can be
used to plot the parameters in realtime of a history of
the parameters. Also there are filters available that
can be used to represent the average values, a sum of
the values, the minimum and the maximum values of the
parameters for a period of time, the density of the
monitored values or the integral of the parameters.
The Groups Panel.
2.10. Topology Panel
Window
This panel is used displays monitoring information
regarding the underlying network topology. For more
details regarding the functionality of this panel
please see The WAN Topology
Section.
The Topology Panel
2.11. Optical Switches
Panel Window
In the MonALISA framework we developed dedicated
modules and agents to monitor and control Optical
Switches. These modules are used now for the CALIENT
switch at CALTECH and the GLIMMERGLASS switch at CERN.
For more details regarding the functionality of this
panel see also The Optical
Control Planes section.
Optical Switches Panel Window
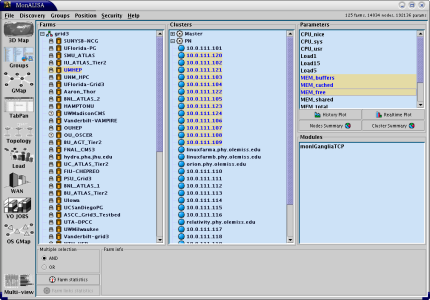
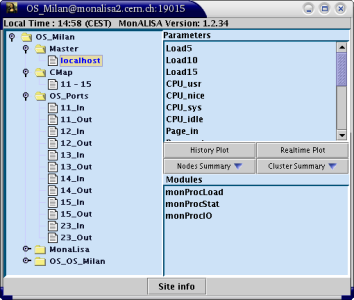
2.12. Node
Properties Window
Left-click on a node in Globe, Graph or World Map
views, brings up a window that shows Node's local time,
IP address, MonALISA version that runs there and
various site information. However, the most important
information is a tree view containing the monitored
clusters and nodes. For each node and cluster on the
right side is an available parameters view. On the
lower-right part the modules list that gather that
information is shown.
The Node's Properties Window
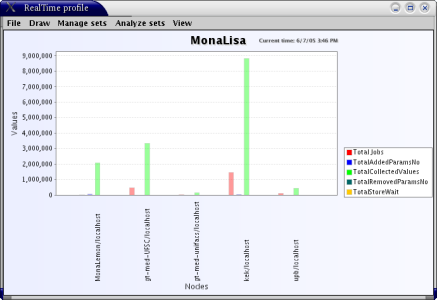
You can select a node, or a cluster from the tree
view and some parameters from the right panel and click
on History or Realtime Plot buttons. A plot window will
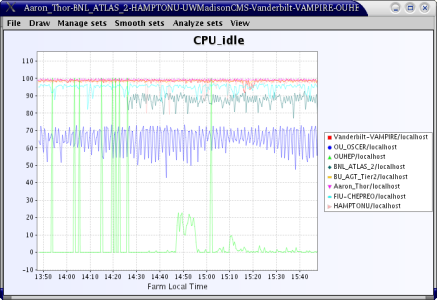
pop-up and soon the requested data will be drawn.
Realtime Plot Window.
History Plot Window.
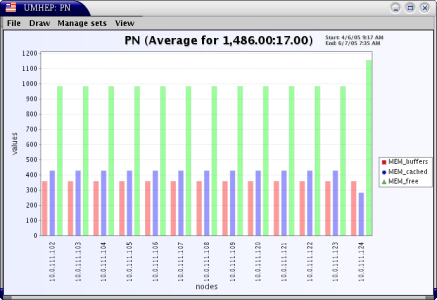
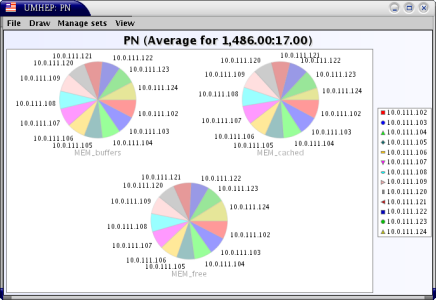
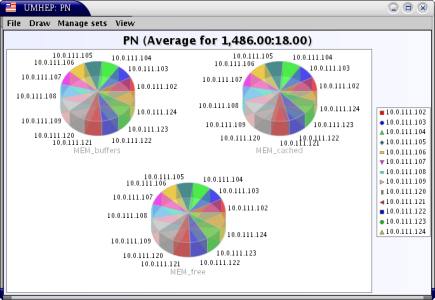
Besides the actual monitored parameter values this
panel offers the possibility of filtering plotting.
Average Bar Plot Window.
Average Pie Plot Window.
Average Pie3D Plot Window.
Min-Max Plot Window.
You can right-click on the graphs to change
different properties (line width, graph background,
axis labels etc.), print or save the graph in a file.
Using the options in the window's menu, you can change
the appearance (3d/2d, stacked/simple, direction),
manage the displayed graph sets (add, remove, change
colors) and analyze sets (integrate, compute median
value etc.).
Chapter 2. Farm
Client
We will present here only the particular features of the
MonALISA Farm Client. For a larger view, please see the Main Window section.
Each node represents a computing farm and is drawn as a
pie chart. The values to be shown in the chart can be
selected from the combo-box that appears above the
graphical part of the panels.
There are two types of links in this client:
ping links - ranging from red to yellow, represent
the quality of the links as computed by the ABPing
module (taking into account the round trip time,
packet loss, and jitter) for each peer of a node.
wan links - ranging from light blue to dark blue,
represent the traffic on the WAN links.
Based on the ping links values, in the Graph panel you
can right-click a farm to compute a path from that node to
all reachable nodes. The client will use the Dijkstra
algorithm and the selected links will be drawn in blue.
Note that this will form a tree and the tree layout modes
will be available.
Chapter 3. VRVS
Client
We will present here only the particular features of the
MonALISA Farm Client. For a larger view, please see the Main Window section.
Each node is drawn in a specific color, representing the
selected value in the combo-box on top of the graphic
panel. For example, if in the combo-box the selected value
is that of the Total Traffic, the application will compute
a minimum and maximum value for all VRVS reflectors. Beside
the combo box, a color scale will be drawn, representing
lower traffic with a light blue and higher traffic with a
darker blue. All the nodes on the Globe, World Map and
Graph Panels will be coloured with a blue nuance according
to their own traffic.
When there is no data coming from the reflector for the
currently selected item in the combo box, the node will be
drawn in pink in the panels. If there is no data from a
reflector (no information about ping or peer links, no data
about the number of clients, virtual rooms, traffic or
load), the node will be painted in red. However, this
doesn't mean that the node is down - you may be able to
open node's properties window and plot different parameters
from other clusters.
There are two types of links between the reflectors:
peer links - ranging from red to green - represent
the quality of the links between the reflectors, as
it is measured by the reflector software. You can
choose from the Peer links combo-box the value to be
displayed (mediated for 2, 12 or 24 hours).
ping links - ranging from red to yellow, represent
the quality of the links as computed by the ABPing
module (taking into account the round trip time,
packet loss, and jitter) for each peer of a node.
mst links - represent the links that should be
used as peer links for the reflectors. These are
dynamically computed by the client based on the
values of the ping links and the status of the
reflectors.
You can hide or show the links using the checkboxes
above the graphical area of the panels.
Note that both peer links and mst links connect the
nodes in a tree structure. You can use each of those in the
Graph Panel to generate various tree layouts.