LISA (Localhost Information Service Agent) is one of the component applications of MonALISA. This application
helps in optimizing others applications by means of monitoring services. For that LISA was implemented in a centric
manner in which a core component deals with monitoring services and on top of which numerous other applications can act
as listeners for the obtained results.
A first advantage of LISA is that it can operate independent of the operating system platform.
For that purpose LISA was written in Java. But LISA also contains code which had to be written in C and connected to the
whole using the JNI technology. As a result LISA can run on Linux (with different versions of kernels, including 2.6),
Windows and MacOS.
Using the WebStart technology, LISA can be started from
anywhere, with just a single click in a browser window.
In order to run LISA, the following
program tools must be installed:
LISA can run on Windows, Linux and MacOS operating systems. If you have any problems installing LISA
please contact The Support Team.
In the core LISA is composed of several monitoring parts which help together in best describing the local
system current functioning parameters. Even better, these monitoring modules can be easily extended and others can be
added as well.
Each monitoring module can be dynamically started or stopped (even if LISA is running).
Also at any time a client application can be dynamically connected or disconnected from LISA. Even though LISA can run
without any Graphical Interface as a standalone application (you can download from
here such a running version of LISA) in this section we will
describe the main features of the GUI client application integrated with LISA.
The main panel of LISA (see figure 1) is composed of two main components. The left panel
can be used to select between the different views associated generally with one of the running monitoring module.
When selecting one of the views from the left panel in the right panel a corresponding panel will appear.
This panel usually shows the current status (current values of the monitored parameters) of the associated module.
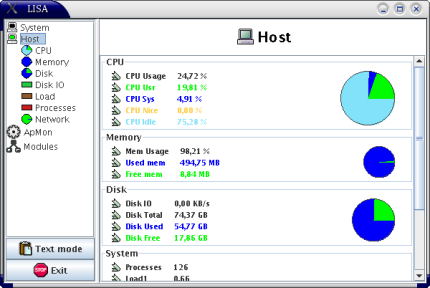
Fig. 1. LISA's Main Window.
In the next sections we will look in detail at the various types of monitoring features of LISA.
4. System Monitoring Panel.
One of the monitoring module of LISA is the System Monitoring Module. This module offers environmental
information such as the type of operating system and version, the user under which LISA is run, JVM version,
local IP address (or even if the address is a private one the public address which stands for point of access to
the local network), the AS to which the station belongs and so on.
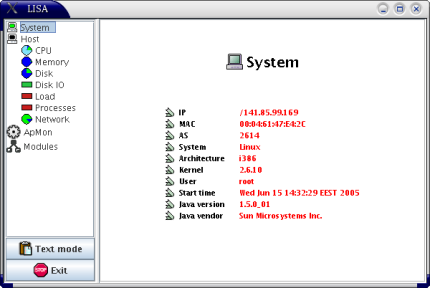
Fig. 2. The System Monitoring Module View.
5. Host Monitoring Panel.
Another module is the host module. This is the most complex module because it offers information regarding
the global running parameters of the local station. This information is classified into information regarding CPU
utilization (how much of the CPU is used by the user applications, by the system or is idle), regarding memory
utilization (free memory and total memory available in the system, page swapping), regarding disk utilization (free
disk space and total disk space), regarding the current load of the system (load1, load5, load15) or the number of
running processes and information regarding networking (in and out for each available network interface).
For this module there are a number of possible views that details the current values of the monitored parameters.
By clicking on the Host icon you can see the general view for the module (see figure 3).
Also for each monitored part of the system (CPU parameters, Memory parameters and so on) there are a number
of other views that show in more detail the monitored status of the parameters. Those other views are details in
the following sections.

Fig. 3. The Host Monitoring Module Global View.
6. Host Details Monitoring Panels.
The host monitoring module deals with
parameters that describe the dynamical behaviour of the monitored local system. For that
module LISA contains views that show the behaviour of the monitored parameters over time.
In LISA's left panel you have the possibility to select from a number of views associated
with the host monitoring module (CPU, Memory,
Disk, DiskIO, Load.
Processes, Network). This panels group
the host monitoring module's parameters according to their domain.
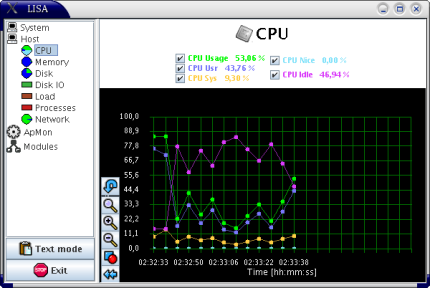
Fig. 4. CPU Related Parameters.
In the details monitoring panels there are two sections of interest. The upper panel shows the last
values of the parameters along with their name. In the lower panel are plotted
the values of those parameters over the last 20 minutes. In that panel a number of additional
features are available, such as the zoom possibility or the possibility to change the color settings.
One of the features available is the possibility of viewing the history of the values over the time
since LISA was started.
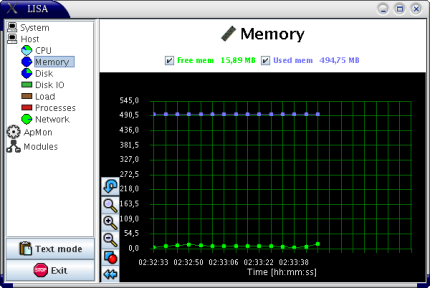
Fig. 5. Memory Related Parameters.
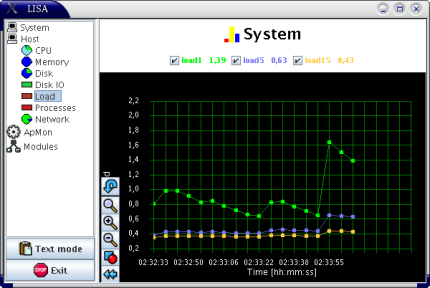
Fig. 6. Load Related Parameters.
7. Hardware Monitoring Panel.
LISA also contains a module that monitors the hardware configuration of the local station. This panel
shows the current hardware configuration of the localhost in a hierarchical mode (each hardware part
can belong to some other harware component). By clicking on a hardware component from the tree you can
see more specific details of that component.
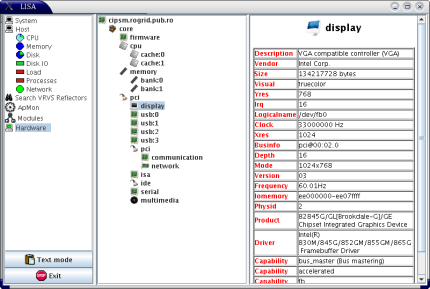
Fig. 8. Hardware Monitoring Panel.
8. Iperf Monitoring Panel.
LISA contains another monitoring module which can be used to estimate the current available
bandwidth between the local station and a number of other end-point stations from
around the globe.
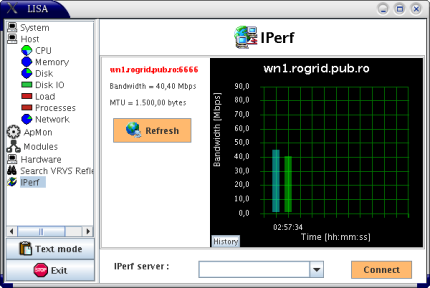
Fig. 9. Iperf Monitoring Panel.
9. Search Best Reflector Monitoring Panel.
As an example of the way LISA can help other applications we helped in assisting the VRVS client module to
dynamically detect the best reflector to which to connect to. The module which helps in MonALISA peers discovery is
the one which provided this functionality to the VRVS application. The best reflectors are read from MonALISA repositories
and are updated in time so that the choosing is performed only from the available reflectors. Then the best reflectors are
chosen based on their network location (Network domain, AS domain, Country, Continent) and on their current load values,
number of currently connected clients, current network traffic. This insures a load balancing order in choosing the
reflectors. Based on this from all the available reflectors the module that chooses some and performs RTT values
measurements.
In this panel the first best reflectors in terms of connectivity found reflectors are shown, together with their
corresponding performance parameter values. In the upper panel from left to right the name of the found reflectors
are listed.
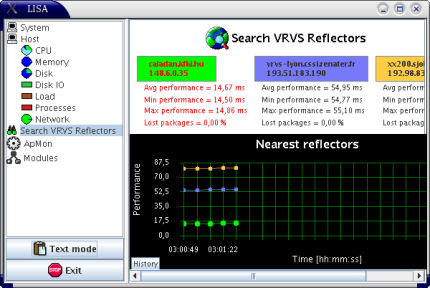
Fig. 10. Search Best Reflector Monitoring Panel.
For each found reflector by clicking on the correspond button from the upper panel you can see a history
of the monitored values corresponding to that reflector, how well it behaved in time since LISA
started monitoring the reflector.
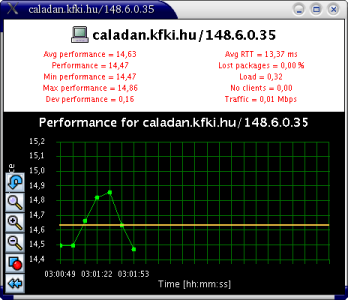
Fig. 11. Search Best Reflector History Monitoring Panel.
10. ApMON Monitoring Panel.
Because LISA is a part of MonALISA there is another module which sends the monitored values back to one or
more MonALISA service. For that this modules uses the ApMON module. Please have a detail look at how the ApMON module
works here.
This panel offers the possibility to monitoring the MonALISA destinations to which the ApMON sends the values.
You can check the current destination, add a new destination address or delete one of the destinations.
Also from this panel you can change the parameters beeing exported to MonALISA using the lower panel.
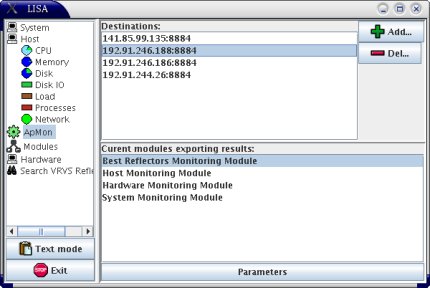
Fig. 12. ApMON Monitoring Panel.
This panel can be used to stop or start any module from LISA. The current running monitoring
modules are listed in the upper panel and the current stopped monitoring modules are listed in
the lower one. By clicking on a module and using the button available you can stop or start that
module.
All the monitored parameters can be viewed in a separate frame in text mode. In this mode the parameters
and the corresponding values are listed under a html form.
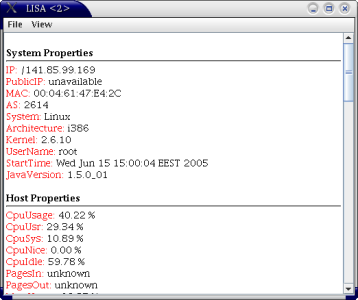
Fig. 14. LISA in Text Mode.
This, and other documents, can
be downloaded from http://monalisa.cacr.caltech.edu/


