Measuring available bandwidth
Using MonALISA framework we have designed and implemented a general measurement environment able to coordinate
end-to-end network performance measurements between distributed sites. The environment may easily integrate existing
tools in order to gather different network parameters.
The available bandwidth is an important performance metric for a network path and different tools are already developed to
perform this kind of measurements. We started by using pathload as it seems to be the most suitable solution at this moment.
Pathload
is a tool developed to non-intrusively
estimate the available end-to-end bandwidth between two hosts.
It uses a sender server (pathload_snd) and a receiver (pathload_rcv)
to transmit packet trains from one host to the other and by measuring
the delay at the packet arrival it establishes the most probable
interval of available bandwidth.
We developed a specialized MonALISA module which makes
use of the tools provided by Pathload in order to collect
and publish the available bandwidth measurements results.
By using a group-level coordination service, the measurements
are performed by every pair of hosts registered in that group.
A token passing algorithm ensures measurement fairness within that
group of hosts.
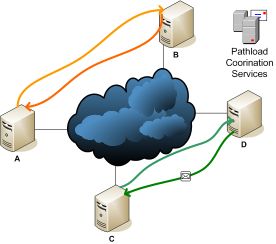
Figure1. The Pathload Control Services coordinate the measurements
Each MonAlisa service is dynamically registered to a
Control Service. There are two waiting queues: one for new
arrivals and one for current Peers. The service targets a mesh
pattern algorithm, everybody measures available bandwidth with
everybody. There are certain rules enforced while doing that:
-
for increasing accuracy, after measuring a path from A to B,
the reverse path from B to A will be measured next
-
for the purpose of not flooding the network, the next token
holder will be the Peer with the least amount of activity
A network measurement with Pathload takes about 10 to 30 seconds
in average depending of the network link. A measurement that exceeds
two minutes will be cut off. A token request, hand-out, measurement
and release takes in average one minute. The traffic made by a measurement
is usually between 5 and 10 Mb.
The results of the measurements can be aggregated by a MonAlisa Repository
in different global views.
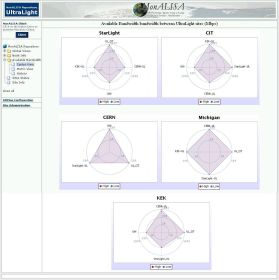
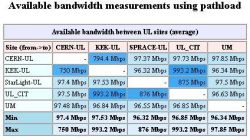
Figure2. Polar view and real-time Matrix View
The polar view and the matrix view are used to get a real-time
update on the available bandwidth between sites. While the fist is
more a graphical approach, the matrix view reveals the overall data
of the current group status.
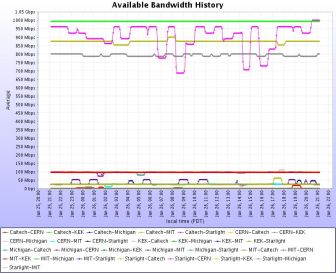
Figure3. Historical view of available bandwidth in time
The data is stored in the repository for a long period of time.
The historical view is used for drawing the evolution of the measured paths.
This data can also be used by higher level services through our API interfaces.
Based on this data, for example, alerts and triggers can influence possible
scheduling or routing algorithms.
In order to configure MonALISA to start the available bandwidth module
please refer to Section 3.6 from the Service User Guide.
For installing the control service please refer to Section 3.7
This, and other documents, can be
downloaded from http://monalisa.cacr.caltech.edu/
For questions about MonALISA, write at
<support@monalisa.cern.ch>.
|